보안 개요의 개요 페이지는 조직 보안 환경에 대한 통합 대시보드를 제공합니다. 기간, 도구 및 기타 기준에 따라 대시보드를 필터링하여 특정 관심 영역에 집중할 수 있습니다. 개요 대시보드, 사용 가능한 메트릭 및 액세스 권한에 대한 자세한 내용은 보안 개요을 참조하세요.
조직 또는 엔터프라이즈에 대한 개요 대시보드 데이터의 CSV 파일을 다운로드할 수 있습니다. 자세한 내용은 보안 개요에서 데이터 내보내기을(를) 참조하세요.
참고
요약 보기(“개요”, “보장”, “위험”)는 기본 경고에 대한 데이터만 표시합니다. Secret scanning 무시된 디렉터리 및 비 공급자 경고에 대한 경고는 모두 이러한 보기에서 생략됩니다. 따라서 개별 경고 보기에는 더 많은 수의 열린 경고와 닫힌 경고가 포함될 수 있습니다.
조직의 보안 개요 대시보드
-
GitHub에서 조직의 기본 페이지로 이동합니다.
-
조직 이름 아래에서 탭을 Security and quality 클릭합니다.
-
개요 페이지는 탭을 클릭한 후 표시되는 기본 보기입니다** Security and quality**. 다른 보안 개요 페이지에서 대시보드로 이동하려면 사이드바에서 개요를 클릭합니다****.
-
기본적으로 감지 탭이 표시됩니다. 다른 메트릭을 보려면 다른 탭으로 전환하려면 수정 또는 방지를 클릭합니다.
-
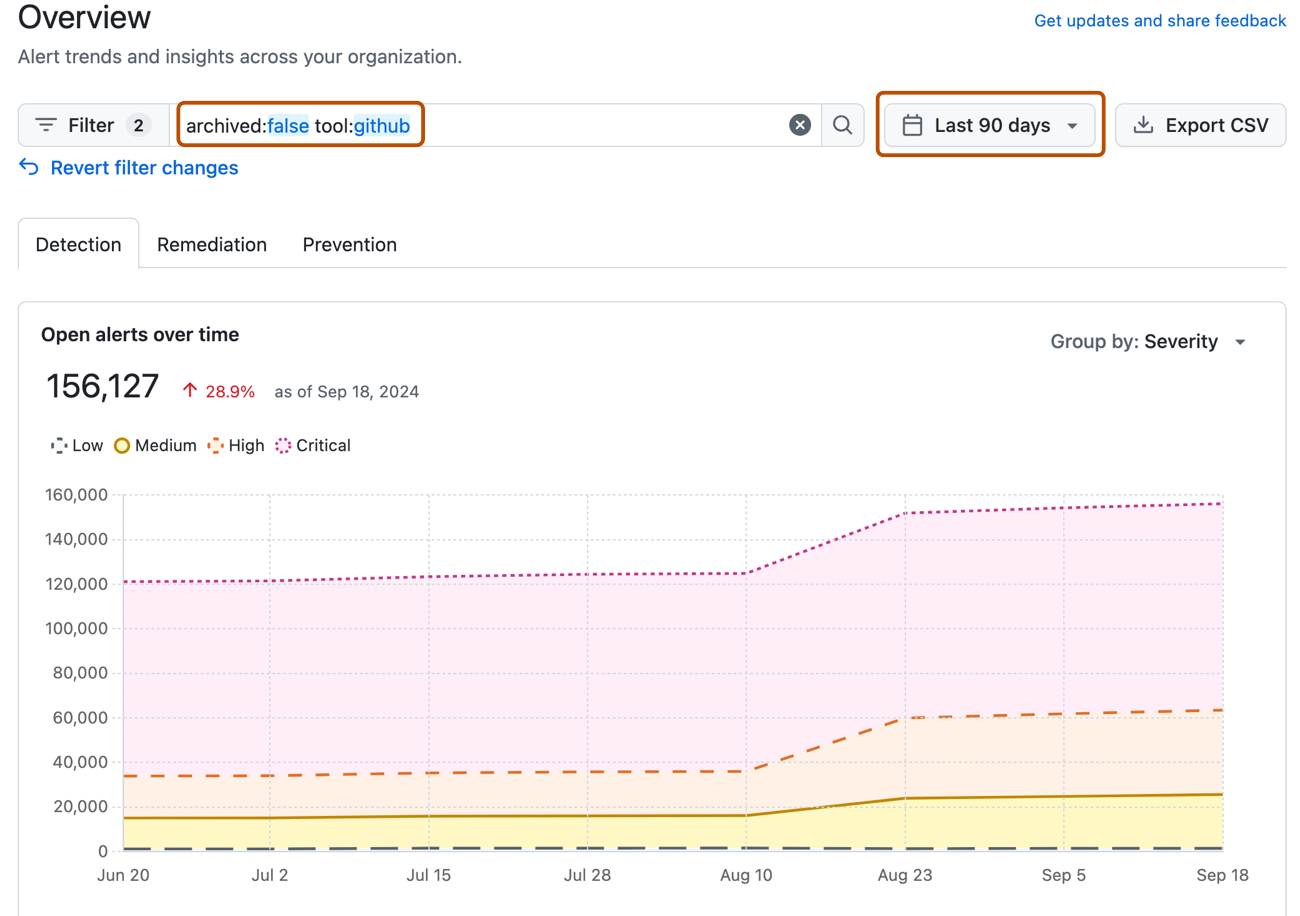
개요 페이지의 맨 위에 있는 옵션을 사용하여 메트릭을 확인할 경고 그룹을 필터링합니다. 필터를 조정하면 해당 페이지의 모든 데이터와 메트릭이 변경됩니다.
- 날짜 선택기를 사용하여 경고 활동 및 메트릭을 확인할 시간 범위를 설정합니다.
- 검색 상자를 클릭하고 표시된 경고 및 메트릭에 대한 필터를 추가합니다.

다음 단계
대시보드에는 조직 경고 상태, 수정 속도 및 고위험 리포지토리에 대한 메트릭이 표시됩니다. 각 메트릭 및 계산 방법에 대한 자세한 설명은 보안 개요 대시보드 메트릭을 참조하세요.
기간, 도구, 리포지토리 및 기타 조건을 기준으로 대시보드를 필터링할 수 있습니다. 자세한 내용은 보안 개요에서 경고 필터링을(를) 참조하세요.