Remarque
Votre administrateur de site doit activer l’code scanning avant de pouvoir utiliser cette fonctionnalité. Pour plus d’informations, consultez « Configuration de l’analyse de code pour votre appliance ».
Vous ne pourrez peut-être pas activer ou désactiver code scanning si un propriétaire d’entreprise a défini une stratégie GitHub Advanced Security au niveau de l’entreprise. Pour plus d’informations, consultez « Application de stratégies de sécurité et d’analyse du code pour votre entreprise ».
Le page d’état de l’outil fournit des informations sur tous vos outils d’analyse de code et constitue un bon point de départ pour déboguer les problèmes. Pour plus d’informations sur l’outil et les informations qu’il fournit, consultez À propos de la page d’état de l’outil.
Consultation du page d’état de l’outil pour un référentiel
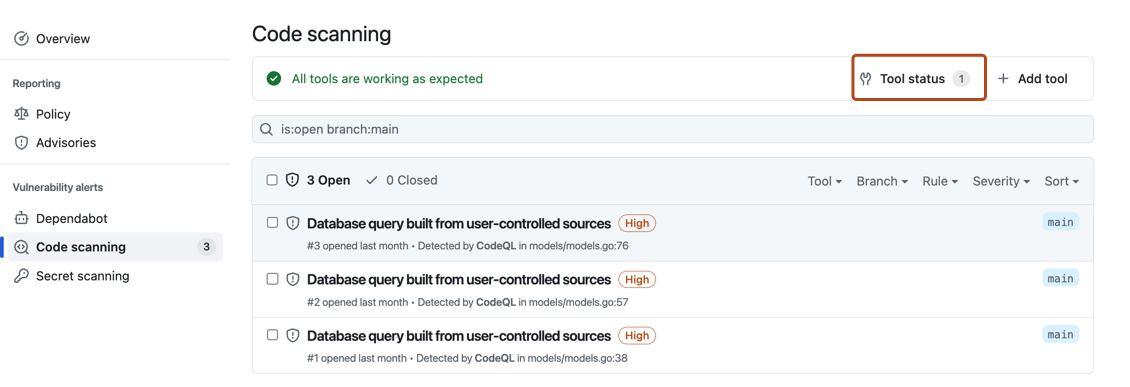
La code scanning page des alertes de chaque référentiel inclut une bannière d’outils avec un résumé de l’état de santé de votre analyse de balayage de code, et un accès à l’exploration page d’état de l’outil de votre configuration.
-
Sur GitHub, accédez à la page principale du référentiel.
-
Sous le nom du référentiel, cliquez sur l’onglet Security . Si vous ne voyez pas l’onglet « Security », sélectionnez le menu déroulant, puis cliquez sur Security.
-
Dans la barre latérale gauche, cliquez sur Code scanning.
-
Cliquez sur État de l’outil dans la bannière Outils.
Utilisation du page d’état de l’outil
Dans le page d’état de l’outil, vous verrez un résumé pour un outil, en surbrillance dans la barre latérale. Vous pouvez utiliser la barre latérale pour afficher les résumés de différents outils.

Pour les outils intégrés tels que CodeQL, vous pouvez voir un pourcentage total de tous les fichiers les plus récemment analysés dans votre référentiel, organisés par langage de programmation. Vous pouvez également télécharger des rapports de langage détaillés au format CSV. Consultez Téléchargement des détails des fichiers analysés.
Accès à des informations détaillées sur les outils
Si vous souhaitez voir des informations plus détaillées sur l’outil affiché, vous pouvez sélectionner une configuration spécifique sous « Types de configuration ».
Sous « Configurations » à gauche de l’écran, vous pouvez voir des informations pour chaque analyse exécutée par ce type de configuration, ainsi que tous les messages d’erreur pertinents. Pour afficher des informations détaillées sur l’exécution d’analyse la plus récente, sélectionnez une configuration dans la barre latérale. Vous pouvez télécharger les détails des règles qui ont été exécutées dans cette analyse du code et le nombre d’alertes trouvées par chaque règle. Pour plus d’informations, consultez Téléchargement de listes de règles utilisées.

Cette vue affiche également les messages d’erreur. Pour plus d’informations, consultez Débogage avec la page État de l’outil.
Téléchargement des détails des fichiers analysés
Pour les outils intégrés tels que CodeQL, vous pouvez télécharger des rapports détaillés au format CSV page d’état de l’outil. Les informations indiquées sont les suivantes :
- Quelle configuration a été utilisée pour analyser chaque fichier
- Chemin d’accès au fichier
- Langage de programmation du fichier
- Indique si le fichier a été extrait avec succès
Pour télécharger un rapport, sélectionnez un outil qui vous intéresse. Ensuite, en haut à droite de la page, cliquez sur le bouton.
Téléchargement de listes de règles utilisées
Vous pouvez télécharger la liste des règles contre lesquelles code scanning vérifie, au format CSV. Les informations indiquées sont les suivantes :
- Configuration utilisée
- Source de la règle
- Identificateur SARIF
- Nombre d’alertes trouvées
Pour télécharger un rapport, sélectionnez une configuration qui vous intéresse. ** ** Cliquez ensuite en haut à droite de la page, puis sélectionnez Télécharger la liste des règles utilisées.
Suppression de configurations
Vous pouvez supprimer des configurations obsolètes, en double ou indésirables pour la branche par défaut de votre dépôt.
Pour supprimer une configuration, sélectionnez la configuration que vous souhaitez supprimer. ** ** Cliquez ensuite sur le haut à droite de la page, puis sélectionnez Supprimer la configuration. Une fois que vous avez lu l’avertissement relatif aux alertes, pour confirmer la suppression, cliquez sur le bouton Supprimer.
Remarque
Vous ne pouvez utiliser le page d’état de l’outil que pour modifier les configurations de la branche par défaut d’un référentiel. Pour plus d’informations sur la suppression de configurations de branches autres que la branche par défaut, consultez Résoudre les alertes d'analyse de code.
Débogage à l’aide de la page d’état de l’outil
Si vous constatez qu’il existe un problème avec votre analyse à partir de la code scanning page alertes, vous pouvez utiliser l’outil page d’état de l’outil pour identifier le problème. Pour les outils intégrés, vous pouvez voir des messages d’erreur spécifiques dans la section d’informations détaillées, liés à des outils spécifiques code scanning . Ces messages d’erreur contiennent des informations sur la raison pour laquelle l’outil peut ne pas fonctionner comme prévu et sur les actions que vous pouvez effectuer. Pour plus d’informations sur la façon d’accéder à cette section du page d’état de l’outil, consultez Accès à des informations détaillées sur les outils.
Pour les outils intégrés tels que CodeQL, vous pouvez également utiliser des informations de couverture de fichiers pour améliorer votre analyse. Pour plus d’informations sur l’interprétation des pourcentages de couverture des fichiers, consultez À propos de la page d’état de l’outil.
Pour plus d’informations, consultez « Résolution des erreurs d’analyse du code » et « Résolution des problèmes de téléchargements SARIF ».