Affichage des GitHub Actions métriques pour votre organisation
Remarque
Il peut y avoir une différence entre le nombre de travaux de l'onglet Flux de travail et le nombre de travaux de l'onglet Projets en raison de différences dans la manière dont les travaux uniques sont identifiés. Cela n'affecte pas le nombre total de minutes calculées.
-
Dans le coin supérieur droit de GitHub, cliquez sur votre photo de profil, puis sur Vos organisations.
-
Cliquez sur le nom de votre organisation.
-
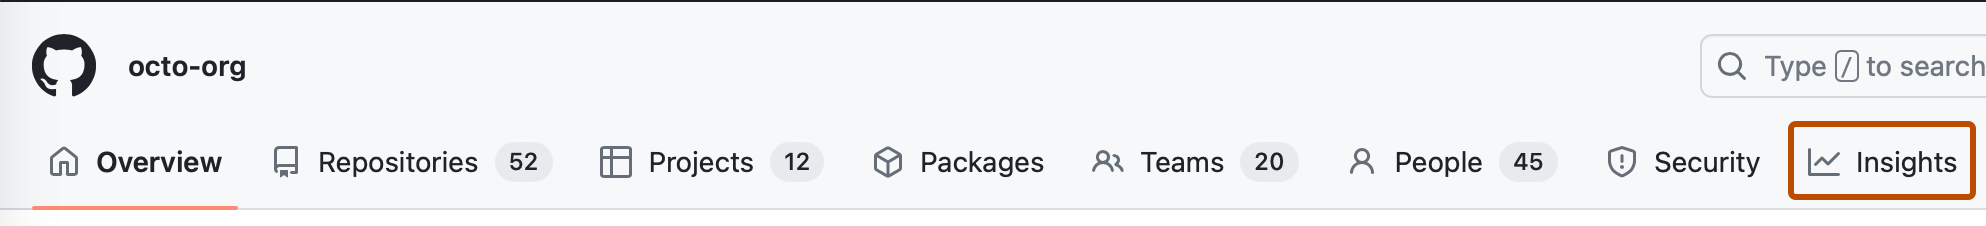
Sous le nom de votre organisationl, cliquez sur Insights.
-
Dans le menu de navigation « Perspectives », cliquez sur Mesures d'utilisation des actions ou cliquez sur Mesures de performance des actions.
-
Si vous le souhaitez, pour sélectionner une période pour laquelle afficher les métriques d'utilisation, choisissez une option dans le menu déroulant Période en haut à droite de la page. Pour plus d’informations, consultez « Affichage des mesures des GitHub Actions ».
-
Cliquez sur l'onglet qui contient les mesures que vous souhaitez consulter. Pour plus d’informations, consultez « À propos des mesures des GitHub Actions ».
-
Si vous le souhaitez, pour filtrer les données affichées dans un onglet, créez un filtre.
- Cliquez sur le bouton Filtre.
- Cliquez sur Ajouter un filtre.
- Choisissez une métrique par laquelle vous souhaitez filtrer les résultats.
- Selon la métrique que vous avez choisie, renseignez les informations dans les colonnes « Qualificateur », « Opérateur » et « Valeur ».
- Vous pouvez également cliquer sur Ajouter un filtre pour ajouter un autre filtre.
- Cliquez sur Appliquer.
-
Si vous le souhaitez, pour télécharger les métriques d'utilisation dans un fichier CSV, cliquez sur .

Affichage des GitHub Actions métriques pour votre référentiel
Remarque
Il peut y avoir une différence entre le nombre de travaux de l'onglet Flux de travail et le nombre de travaux de l'onglet Projets en raison de différences dans la manière dont les travaux uniques sont identifiés. Cela n'affecte pas le nombre total de minutes calculées.
- Sur GitHub, accédez à la page principale du référentiel.
- Sous le nom de votre référentiel, cliquez sur l’onglet Aperçus.
- Dans le menu de navigation « Perspectives », cliquez sur Mesures d'utilisation des actions ou cliquez sur Mesures de performance des actions.
- Si vous le souhaitez, pour sélectionner une période pour laquelle afficher les métriques d'utilisation, choisissez une option dans le menu déroulant Période en haut à droite de la page. Pour plus d’informations, consultez « Affichage des mesures des GitHub Actions ».
- Cliquez sur l'onglet qui contient les mesures que vous souhaitez consulter. Pour plus d’informations, consultez « À propos des mesures des GitHub Actions ».
- Si vous le souhaitez, pour filtrer les données affichées dans un onglet, créez un filtre.
- Cliquez sur le bouton Filtre.
- Cliquez sur Ajouter un filtre.
- Choisissez une métrique par laquelle vous souhaitez filtrer les résultats.
- Selon la métrique que vous avez choisie, renseignez les informations dans les colonnes « Qualificateur », « Opérateur » et « Valeur ».
- Vous pouvez également cliquer sur Ajouter un filtre pour ajouter un autre filtre.
- Cliquez sur Appliquer.
- Si vous le souhaitez, pour télécharger les métriques d'utilisation dans un fichier CSV, cliquez sur .
Comprendre l'agrégation GitHub Actions des métriques
La fonction de sélection des périodes vous permet de visualiser les mesures GitHub Actions sur des périodes prédéfinies, comme indiqué dans le tableau suivant. Ces métriques excluent les exécutions ignorées et celles qui utilisent zéro minutes. Les données sont présentées en jours de temps universel coordonné (UTC).
| Période | Description |
|---|---|
| Semaine en cours (lun-dim) | Données de lundi à ce jour lorsque la page est consultée. |
| Mois en cours | Données allant du premier jour du mois au jour actuel de la consultation de la page. |
| Mois dernier | Données du premier au dernier jour du mois précédent. |
| 30 derniers jours | Données des 30 derniers jours jusqu'à la date de consultation de la page. |
| 90 derniers jours | Données des 90 derniers jours au moment de la consultation de la page. |
| L’année dernière | Données agrégées pour les 12 derniers mois. |
| Personnalisée | Données d’une plage de dates personnalisée. La plage peut être jusqu’à 100 jours, y compris les dates de début et de fin, et revenir jusqu’à un an. |