Die neue Abrechnungsplattform bietet eine allgemeine Übersicht über Ihre Ausgabentrends basierend auf der Nutzung von Produkten. Du kannst diese Informationen verwenden, um deine Ausgaben zu schätzen und fundierte Entscheidungen über dein Budget zu treffen.
Anzeigen der Ausgaben für dein persönliches Konto
- Klicken Sie auf einer beliebigen Seite auf GitHub oben rechts auf Ihr Profilfoto und dann auf Einstellungen.
- Klicke im Abschnitt „Access“ der Seitenleiste auf Billing & Licensing.
Auf dieser Seite kannst du deine Nutzung in den folgenden Kategorien anzeigen:
-
Aktuelle gemessene Nutzung: Die Karte oben links zeigt die gemessene Bruttonutzung für dein persönliches Konto.
-
Gemessene Nutzung: Der Graph zeigt die gemessene Bruttonutzung für dein persönliches Konto.
Um einen anderen Zeitraum anzuzeigen, wähle Zeitrahmen und dann einen Zeitraum aus. Du kannst auch ein Bild oder eine CSV-Datei des Graphen herunterladen, indem du rechts auf klickst.
-
Nach Repository: Die Karte unter dem Graph zeigt die fünf wichtigsten Repositorys an, die die meiste Nutzung generieren. Du kannst in der oberen rechten Ecke jeder Karte auf klicken, um die gesamte Nutzung anzuzeigen, einschließlich einer Aufschlüsselung nach Bruttonutzung im Vergleich zur abrechenbaren Nutzung, abzüglich aller möglichen Rabatte.
-
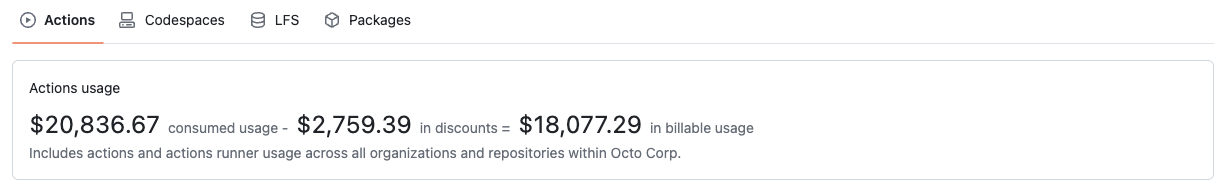
Nach Produkten: Du kannst die Produktregisterkarten verwenden, um die Nutzung und Rabatte für verschiedene Produkte anzuzeigen.

Darüber hinaus kannst du deinen Plan ändern, indem du auf Upgrade to Pro oder Downgrade to Free im Abschnitt „Current plan“ klickst.
Oben auf der Seite kannst du unter „Next payment due“ das Datum deines nächsten Abrechnungszeitraums sehen.
Anzeigen deiner Ausgaben für Organisation
Die Seite „Übersicht“ bietet eine allgemeine Übersicht über deine Ausgaben und Budgets.
- Wähle in der rechten oberen Ecke auf GitHub dein Profilfoto aus, und klicke dann auf Your organizations.
- Klicke neben der Organisation auf Einstellungen.
- Klicke auf der linken Seite der Seite in der Randleiste der Organisation auf Billing & Licensing.
Auf dieser Seite kannst du deine Nutzung in den folgenden Kategorien anzeigen:
-
Aktuelle getaktete Nutzung: Die Karte links oben zeigt die gesamte getaktete Nutzung für Organisation.
-
Getaktete Nutzung: Der Graph zeigt die gesamte getaktete Nutzung für Organisation.
Um einen anderen Zeitraum anzuzeigen, wähle Zeitrahmen und dann einen Zeitraum aus. Du kannst auch ein Bild oder eine CSV-Datei des Graphen herunterladen, indem du rechts auf klickst.
-
Nach Repository: Die Karte unter dem Graph zeigt die fünf wichtigsten Repositorys an, die die meiste Nutzung generieren. Du kannst in der oberen rechten Ecke jeder Karte auf klicken, um alle Nutzungsarten anzuzeigen, einschließlich einer Aufschlüsselung nach Bruttonutzungsverse, die abgerechnet werden können (minus alle Rabatte, die gelten können).
-
Nach Produkten: Du kannst die Produktregisterkarten verwenden, um die Nutzung und Rabatte für verschiedene Produkte anzuzeigen.
Hinweis
Wenn du GitHub Secret Protection, GitHub Code Security, or GitHub Advanced Security aktivierst, liegt eine Verzögerung von bis zu zwei Stunden vor der Anzeige der Änderung in den Nutzungsdaten auf der Registerkarte „Billing & Licensing“ vor.
Budgetverfolgung
Unten auf der Seite unter „Budgets“ kannst du deine aktuellen Budgets sehen und wie viel du von diesen Budgets ausgegeben hast. Wenn deine Rolle dir Zugriff gewährt, kannst du ein Budget bearbeiten oder löschen, indem du rechts neben dem Budget auf klickst. Weitere Informationen findest du unter Rollen für die neue Abrechnungsplattform.
Wenn du dein gesamtes Budget verwendet hast, wird oben auf der Seite ein rotes Banner angezeigt. Du kannst auf Budget aktualisieren klicken, um dein Budget zu erhöhen.
Erstellen eines Budgets
Als Unternehmensbesitzerin oder Abrechnungsmanagerin kannst du das Budget für dein Unternehmen, deine Organisation innerhalb deines Unternehmens oder eine Kostenstelle festlegen. Als Organisationsbesitzer*in kannst du die Budgets für die von dir verwalteten Repositorys festlegen. Weitere Informationen findest du unter Using budgets to control spending on metered products.