The new billing platform provides a high-level view of your spending trends based on the usage across products. You can use this information to estimate your spending and make informed decisions about your budget.
Viewing your spending for your personal account
- GitHub의 페이지 오른쪽 상단에서 프로필 사진을 선택한 다음, 설정을 선택합니다.
- In the "Access" section of the sidebar, click Billing & Licensing.
On this page, you can view your usage in the following categories:
-
Current metered usage: The card on the top left shows the gross metered usage for your personal account.
-
Metered usage: The graph shows the gross metered usage for your personal account.
To view a different time period, select Time Frame, then choose a time period. You can also download an image or CSV of the graph by clicking on the right.
-
By repository: The card under the graph shows the top five repositories that generate the most usage. You can click in the upper-right corner of each card to view all usage, including a break down by gross usage versus billable usage (minus any discounts that may apply).
-
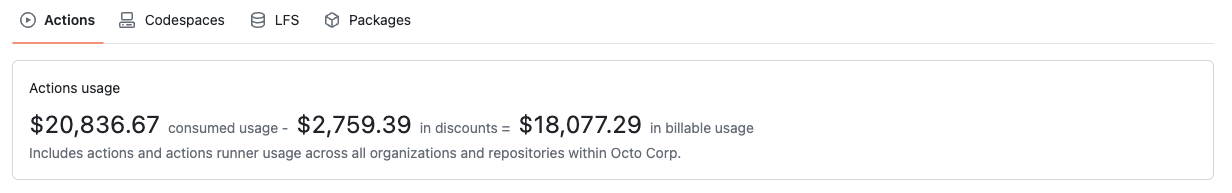
By products: You can use the product tabs to view usage and discounts for different products.

Additionally, you can change your plan by clicking Upgrade to Pro or Downgrade to Free in the "Current plan" section.
At the top of the page, under "Next payment due", you can see the date of your next billing cycle.
Viewing your spending for your 조직
The "Overview" page provides a high-level view of your spending and budgets.
- GitHub의 오른쪽 위 모서리에서 프로필 사진을 선택한 다음, Your organizations를 클릭합니다.
- 조직 옆에 있는 설정을 클릭합니다.
- 페이지 왼쪽의 organization 사이드바에서 Billing & Licensing을 클릭합니다.
On this page, you can view your usage in the following categories:
-
Current metered usage: The card on the top left shows the gross metered usage for your 조직.
-
Metered usage: The graph shows the gross metered usage for your 조직.
To view a different time period, select Time Frame, then choose a time period. You can also download an image or CSV of the graph by clicking on the right.
-
By repository: The card under the graph shows the top five repositories that generate the most usage. You can click in the upper-right corner of each card to view all usage, including a break down by gross usage verse billable usage (minus any discounts that may apply).
-
By products: You can use the product tabs to view usage and discounts for different products.
Note
GitHub Secret Protection or GitHub Code Security를 사용하도록 설정하면 “Billing & Licensing” 탭의 사용량 현황 데이터에 변경 내용이 표시되기까지 최대 2시간이 지연됩니다.
Tracking budgets
At the bottom of the page, under "Budgets", you can see your current budgets, and how much you have spent against those budgets. If your role provides access, you can edit or delete a budget by clicking to the right of a budget. See Roles for the new billing platform.
If you have used all of your budget, a red banner appears at the top of the page. You can click Update your budget to increase your budget.
Creating a budget
As an enterprise owner or billing manager, you can set the budget for your enterprise, an organization within your enterprise, or a cost center. As an organization owner, you are able to set the budgets for the repositories you manage. See Preventing overspending.