セキュリティの概要の概要ページには、組織 または企業のセキュリティランドスケープの統合されたダッシュボードが表示されます。 期間、ツール、その他の条件でダッシュボードをフィルター処理して、関心のある特定の領域に焦点を当てることができます。 概要ダッシュボード、使用可能なメトリック、アクセス許可の詳細については、「 セキュリティの概要」を参照してください。
組織または企業の概要ダッシュボード データの CSV ファイルをダウンロードできます。 詳しくは、「セキュリティの概要からデータをエクスポート」をご覧ください。
メモ
概要ビュー ([Overview (概要)]、[Coverage (カバレッジ)]、[Risk (リスク)]) には、既定のアラートに対応するデータのみが表示されます。 Secret scanning 無視されたディレクトリおよびプロバイダー以外のアラートはすべて、これらのビューから省略されます。 そのため、個々のアラート ビューには、開いているアラートと閉じられたアラートの数が多い場合があります。
組織のセキュリティ概要ダッシュボード を表示する
-
GitHub で、organization のメイン ページに移動します。
-
組織名の下の [ Security and quality ] タブをクリックします。
-
概要ページは、 Security and quality タブをクリックした後に表示されるプライマリ ビューです。別のセキュリティの概要ページからダッシュボードにアクセスするには、サイドバーの [概要] クリックします。
-
既定では、[検出] タブが表示されます。 別のタブに切り替えて他のメトリックを表示する場合は、[ 修復] または [ 防止] をクリックします。
-
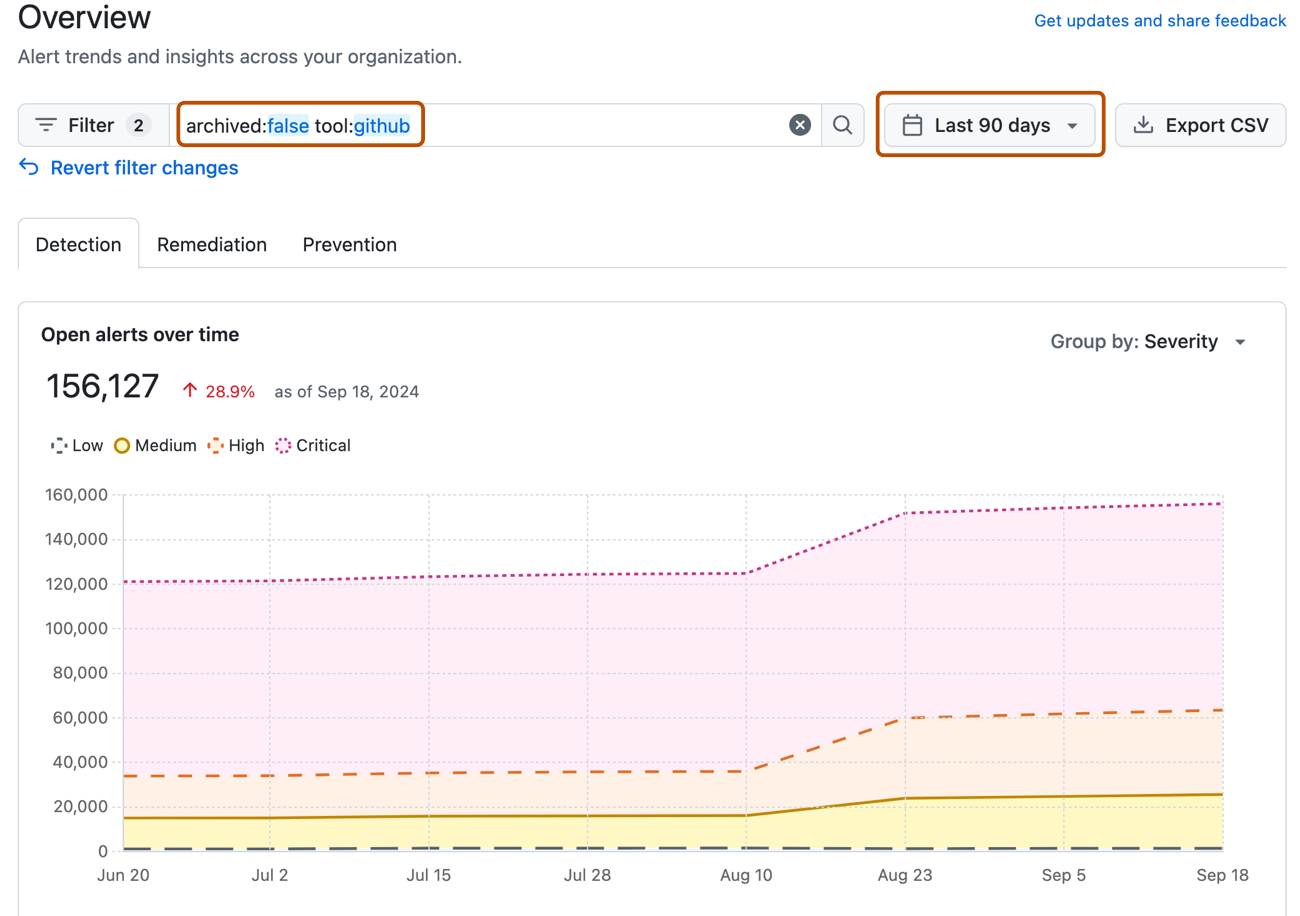
概要ページの上部にあるオプションを使用して、メトリックを表示するアラートのグループをフィルター処理します。 フィルターを調整すると、ページ上のすべてのデータとメトリックが変更されます。
- 日付ピッカーを使用して、アラート アクティビティとメトリックを表示する時間範囲を設定します。
- 検索ボックスをクリックすると、表示されるアラートとメトリックにさらにフィルターを追加します。

企業のセキュリティ概要ダッシュボードの表示
-
GitHub Enterprise Cloud に移動します。
-
GitHub の右上隅にあるプロフィール画像をクリックします。
-
環境に応じて、[ エンタープライズ] をクリックするか、[ エンタープライズ ] をクリックして、表示するエンタープライズをクリックします。
-
ページの上部にある [ Security and quality ] タブをクリックします。
-
既定では、[検出] タブが表示されます。 別のタブに切り替えて他のメトリックを表示する場合は、[ 修復] または [ 防止] をクリックします。
-
概要ページの上部にあるオプションを使用して、メトリックを表示するアラートのグループをフィルター処理します。 フィルターを調整すると、ページ上のすべてのデータとメトリックが変更されます。
- 日付ピッカーを使用して、アラート アクティビティとメトリックを表示する時間範囲を設定します。
- 検索ボックスをクリックすると、表示されるアラートとメトリックにさらにフィルターを追加します。
ヒント
検索フィールドで owner フィルターを使って、データを organization ごとにフィルター処理できます。 マネージド ユーザーを含む Enterprise の所有者である場合は、owner-type フィルターを使用して、データをリポジトリ所有者の種類ごとにフィルター処理し、organization 所有のリポジトリまたはユーザー所有のリポジトリのデータを表示できます。 詳細については、「セキュリティの概要でアラートをフィルター処理する」を参照してください。
次のステップ
ダッシュボードには、組織内、 または企業のアラートの状態、修復速度、および高リスクリポジトリに関するメトリックが表示されます。 各メトリックとその計算方法の詳細については、 セキュリティの概要ダッシュボードのメトリック を参照してください。
期間、ツール、リポジトリ、その他の条件でダッシュボードをフィルター処理できます。 詳しくは、「セキュリティの概要でアラートをフィルター処理する」をご覧ください。